Home
Welcome to the Python Extensive Course!  This course will teach you the Python
programming language.
This course will teach you the Python
programming language.
That's the power of Python - ease of use paired with a wide range of functionalities stemming from a large developer community! 🦾
Why Python?
-
Ease of use
Pythonwith its syntax is easy to learn and yet very powerful. -
Flexible
Pythonis a versatile language that can be used for data analysis, automation, artificial intelligence, and many more applications.
The below section should give you an impression of what you can do with
Python. This is not an extensive list by all means. It might sound
trashy but if you can imagine something you probably can build it in
Python.
Info
Don't worry about the code snippets too much, after finishing the course you'll have a better understanding and will be able to run and modify code yourself. For now, the following snippets illustrate the capabilities of the language and what complex things you can achieve with little code. There is no need to execute it - Just take a look!
Examples
Just the beginning...
All of the following examples are from one of the courses featured on our
website. If you stick around and explore subsequent Python courses you
will be able to easily implement all examples yourself! 
Machine Learning
With Python you can easily train your own machine learning models. In this
example, with just a few lines of code, one such model (a decision tree) is
fit and visualized1.

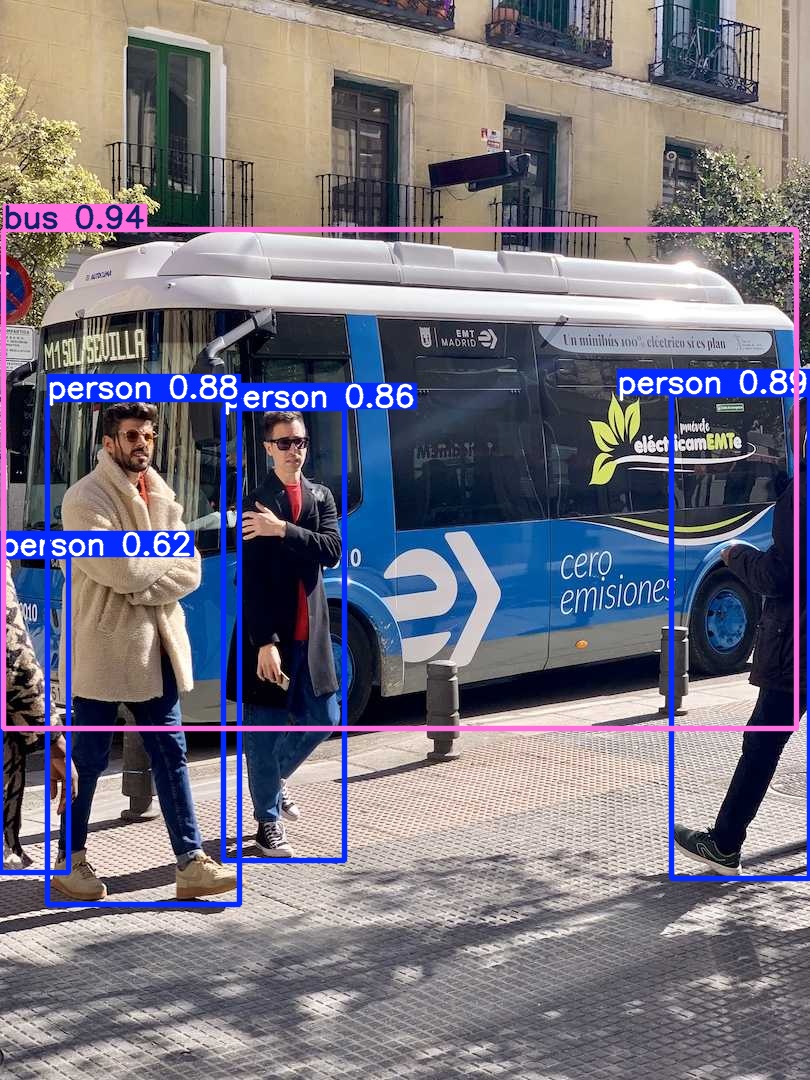
Computer Vision/AI
Or how about state-of-the-art computer vision with YOLO2?
Automation
But it's not just machine learning and AI, you can also automate mundane tasks. This code snippet fetches some data (from an online service) and writes an Excel file3.
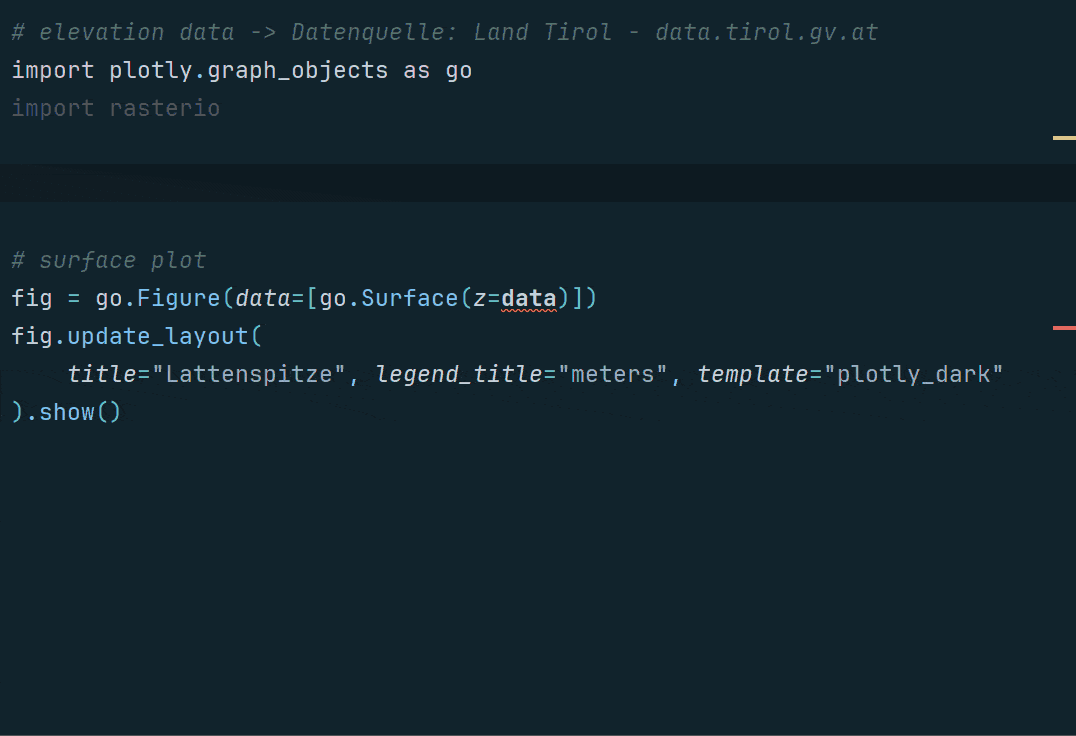
Visualizations
You can create stunning and interactive visualizations4. Let's visualize the above written Excel file.
Web Development
You can create websites, just like this one. In fact, all the
heavy lifting of this site is done by Python and tools developed by its
community.
The most important package used to build this site was
Material for MkDocs,
a widely used and customizable static site generator. 
Getting Started...
In the next sections, we will install Python including the code editor
Visual Studio Code.
Tip
Both Python and Visual Studio Code are already pre-installed on PCs in the MCI computer rooms. If you are working with your own computer, please proceed to the next page.
-
Scikit-learn is a Python package for machine learning. ↩
-
YOLO is an advanced real-time object detection model known for its speed and accuracy, enabling efficient identification and localization of objects within images and videos. ↩
-
Plotly is a Python graphing package that lets you create interactive, publication-quality graphs. ↩