Hypothesis
(In)dependent Variables
Let's begin with the basic concepts of independent variables (IVs) and dependent variables (DVs).
- The dependent variable is what you're aiming to explain or predict in your study (the target).
- The independent variables are the factors you believe will influence or cause changes in the dependent variable (the features).
In experimental research, independent variables are what you manipulate or control to observe their effect on the dependent variable. For example, if you're studying the effect of water on a plant, the amount of water is the independent variable, and the size or number of leaves are the dependent variable.
Controlable Variables
Not all independent variables are under your control; some are observed variables that you believe have an impact on the dependent variable.

Let's explore a few examples.
Examples: IV/DV Easy
-
The effect of sleep duration on cognitive function.
- IV: Sleep duration—it's what you might manipulate or measure to see its effect.
- DV: Cognitive function—the outcome you're trying to explain or predict.
-
The relationship between socioeconomic status and health outcomes.
- IV: Socioeconomic status—it potentially influences health outcomes.
- DV: Health outcomes—the aspect you're studying in relation to socioeconomic status.
-
Does the amount of screen time affect children's attention spans?
- IV: Amount of screen time - this is the variable you might adjust or observe.
- DV: Children's attention spans - the outcome you're assessing.
In some cases, distinguishing between the IV and DV can be ambiguous. For instance:
Examples: IV/DV Difficult
The correlation between stress levels and physical activity.
It's not immediately clear which variable influences the other. Does increased stress lead to less physical activity, or does less physical activity contribute to higher stress levels? Depending on your research focus, you might assign stress levels as the IV and physical activity as the DV, or vice versa.
Models and Modeling

Definition
Models are simplified representations of reality, designed to explain or predict phenomena by highlighting essential features while ignoring less critical details. The real world is incredibly complex, and models help us make sense of it by focusing on key variables.
Examples: Model
Consider, for example, modeling what influences a person's academic performance. A simple model might include:
- Study Time: More hours spent studying could lead to better performance.
- Class Attendance: Regular attendance might improve understanding of the material.
- Access to Resources: Availability of textbooks and learning materials could enhance learning.
Our model might look something like this:
Here, \( \beta_1, \beta_2, \beta_3 \) are coefficients representing the influence of each independent variable, and \( \epsilon \) is the residual or error term. The residual captures all other factors affecting academic performance that aren't included in the model.
Residuals
Residuals are a key component in evaluating the effectiveness of a statistical model. They represent the difference between the observed data points and the values predicted by the model
Interpretation: Residuals
Residuals essentially capturing what the model fails to explain.
For example, suppose you're modeling the impact of study time (independent variable) on test scores (dependent variable). After applying your model, you find that some students scored higher or lower than predicted. These differences are the residuals.
- Small residuals imply that the model accurately captures the relationship between study time and test scores.
- On the other hand, large residuals indicate that there are other factors - like prior knowledge or test anxiety - not accounted for in the model.
Analyzing residuals helps you identify shortcomings in your model and areas where it can be refined for better accuracy.
Fitting
In modeling, there's a crucial balance between simplicity and accuracy:
- Underfitting: A model that's too simple may not capture important patterns in the data, leading to large residuals and poor predictions.
- Overfitting: A model that's too complex may fit the training data too closely, including the noise, and may not generalize well to new data.
- Optimal Model: A model with an optimal fit captures the underlying trend without fitting the noise.
The goal is to develop a model that's as simple as possible but still effectively explains the data - a concept known as Occam's Razor in philosophy.
Models vs Hypothesis
Let's touch on hypothesis testing. In statistics, hypothesis testing is essentially about comparing models to see which one better fits the data. A hypothesis might propose that one model is superior to another in explaining a particular phenomenon.
For example:
- Null Hypothesis (\( H_0 \)): There is no effect of study time on exam scores - the simpler model without the study time variable fits the data just as well.
- Alternative Hypothesis (\( H_1 \)): Study time does affect exam scores - the model including study time provides a better fit.
By testing these hypotheses, we're evaluating whether adding a variable (making the model more complex) significantly improves our ability to explain the dependent variable.
Hypothesis
In this section, we'll delve into the concept of hypothesis testing, a cornerstone of statistical analysis. Understanding what a hypothesis is and how to formulate a strong one is essential for designing experiments and interpreting data effectively.

What Is a Hypothesis?
Hypothesis: an idea or explanation for something that is based on known facts but has not yet been proved
So in other words, a hypothesis is a testable statement that predicts a relationship between variables. It is an educated guess based on prior knowledge and observation, which can be rejected or not through experimentation or further observation. Crucially, a hypothesis must be falsifiable, meaning there must be a possible negative answer to the hypothesis.
Hypotheses serve several critical functions in research and data analysis:
- Enhance Experimental Design: They provide a clear focus and direction for designing experiments.
- Promote Critical Thinking: Formulating hypotheses encourages logical reasoning and careful consideration of potential outcomes.
- Guide Data Analysis: They help determine which statistical tests to use and how to interpret the results.
- Advance Knowledge: Hypotheses enable the development and refinement of theories, contributing to scientific progress.
- Test Theories: They allow researchers to challenge existing theories and potentially replace them with more accurate ones.
By converting abstract ideas into specific, testable predictions, hypotheses facilitate meaningful research and discoveries.
Characteristics of a Hypothesis
A Hypothesis should fullfill some requirements to be considered as strong. Those requirement are:
- Clear and Specific: It precisely states the expected relationship between variables.
- Testable and Falsifiable: It can be supported or refuted through experimentation or observation.
- Based on Existing Knowledge: It relies on prior research or established theories.
- Predictive: It makes definite predictions about outcomes.
- Relevant: It has implications for understanding broader phenomena, not just a single dataset.
- Directional (when appropriate): It specifies the expected direction of the relationship (e.g., increases, decreases).
Not a Hypothesis
"Technology is changing rapidly."
Explanation: This is a general observation, not a testable hypothesis. It lacks specificity and does not predict a measurable outcome.
Weak Hypothesis
"Eating fruits affects health."
Explanation: While somewhat testable, it's vague. It doesn't specify which fruits, what aspect of health, or the nature of the effect.
Strong Hypothesis
"Adults who eat an apple a day have lower cholesterol levels than those who do not."
Explanation*: This hypothesis is specific, testable, and based on prior knowledge about the health benefits of apples. It predicts a measurable outcome (cholesterol levels) in a defined group (adults).
To explore the concept of hypothesis characteristics we can practice on some examples
Task: Hypothesis Characteristics
Let's practice by classifying some statements (no/weak/strong hypothesis):
- "Does exercise improve mental health?"
- "Drinking green tea leads to weight loss."
- "College students who sleep at least 7 hours per night have higher GPAs than those who sleep less."
- "Reading improves language skills."
- "Children exposed to bilingual education from an early age will perform better on cognitive flexibility tests than those who are not."
The Null Hypothesis
In statistical testing, we often work with two hypotheses:
Definition: Null & Alternative Hypothesis
- Null Hypothesis (\( H_0 \)): Assumes no effect or no difference between groups or variables.
- Alternative Hypothesis (\( H_1 \) or \( H_a \)): Proposes that there is an effect or a difference.
Examples: \( H_0 \) & \( H_1 \)
- Null Hypothesis \( H_0 \): "Listening to classical music while studying has no effect on memory retention in high school students."
- Alternative Hypothesis \( H_1 \): "Listening to classical music while studying improves memory retention in high school students."
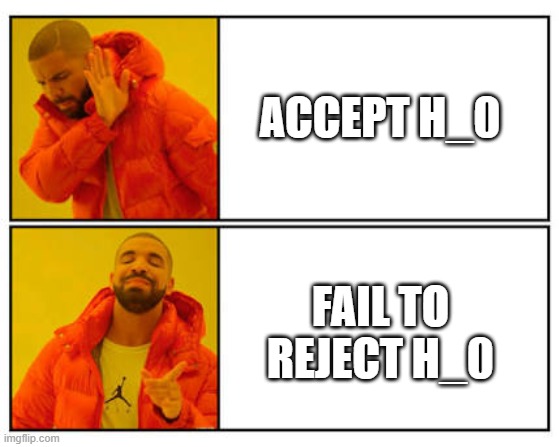
In statistical analyses, we test the null hypothesis to determine whether there is sufficient evidence to reject it in favor of the alternative hypothesis. Rejecting the null hypothesis suggests that the data support the alternative hypothesis.

But why Focus on the Null Hypothesis?
- Statistical Simplicity: It's mathematically simpler to test for no effect than to prove a specific effect.
- Avoiding Bias: It prevents researchers from seeing effects that aren't there due to expectations.
- Falsifiability: It's easier to disprove (falsify) a universal negative (no effect) than to prove a universal positive.
Recap
- Independent Variables (IVs): Factors you believe influence the outcome.
- Dependent Variables (DVs): The outcomes you're trying to explain or predict.
- Models: Simplified representations of reality using equations to explain relationships between variables.
- Residuals: Differences between the observed data and what the model predicts; they capture unexplained variability.
- Balance in Modeling: Aim for models that are simple yet sufficiently complex to accurately capture the underlying patterns in the data.
- Hypothesis Testing: A method of comparing models to determine which one better explains the data.
Understanding how to formulate and test hypotheses is essential for conducting rigorous research and making meaningful contributions to knowledge. A strong hypothesis guides the research process, informs experimental design, and provides a basis for interpreting results. By mastering hypothesis testing, you enhance your ability to analyze data critically and draw valid conclusions.